The project’s purpose is to develop a Convolutional Neural Network (CNN) to classify and predict images using Python’s TensorFlow package.
Methodology:
- Load the data and flatten the input to feed into the model using tf.keras.layers.Flatten()
- Compile the model using model.compile()
- Train the model with the training data and training labels using model.fit()
- Evaluate the model with the test dataset and print a few of the test image labels with predictions to test accuracy
CIFAR-10 Data:
Data set retrieved from Keras package. The CIFAR-10 data set consists of 60,000 color images in 10 classes. The data set contains 50,000 training images and 10,000 test images.
Image Classes:
- Airplane
- Automobile
- Bird
- Cat
- Deer
- Dog
- Frog
- Horse
- Ship
- Truck
Relevant data set links:
https://keras.io/datasets/
https://www.cs.toronto.edu/~kriz/cifar.html
Results:
A model with epoch of 10 and a batch size of 64 with a test loss of 1.5843.
1. Loading Relevant Libraries and CIFAR-10 Data
1
2
3
4
5
6
7
import tensorflow as tf
import mitdeeplearning as mdl
import matplotlib.pyplot as plt
import numpy as np
import random
from tqdm import tqdm
from keras.datasets import cifar10
1
(x_train, y_train), (x_test, y_test) = cifar10.load_data()
Let’s check the shape of the training set.
1
np.shape(x_train)
Output:
(50000, 32, 32, 3)
There are 50,000 32x32 colored images in the training set.
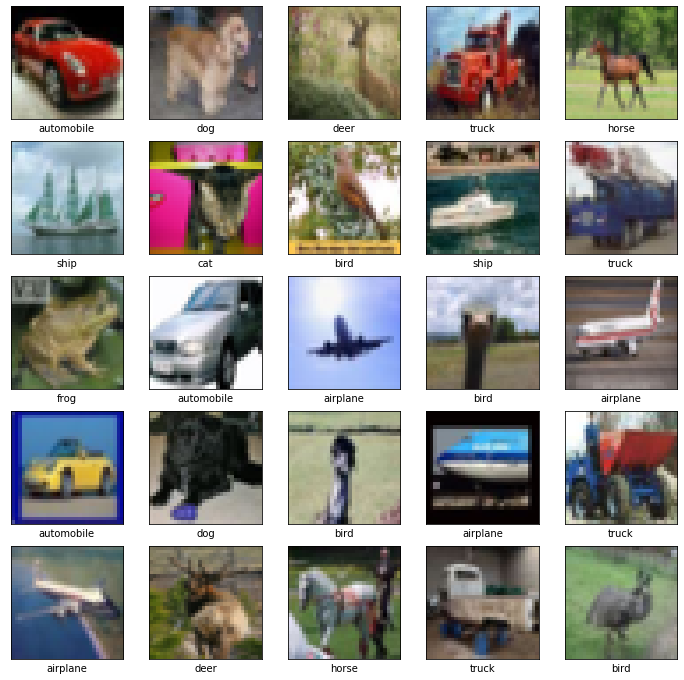
Let’s visualize a few of the training images with corresponding training labels below.
The training and testing labels are numeric so we will need to
pair them with a class_names vector.
1
2
3
4
5
6
7
8
9
10
11
12
13
14
15
class_names = ['airplane', 'automobile', 'bird', 'cat', 'deer', 'dog',
               'frog', 'horse', 'ship', 'truck']

# Plot 25 random images from the training set with labels
random_inds = np.random.choice(50000,25)
plt.figure(figsize=(12,12))
for i in range(25):
    plt.subplot(5,5,i+1)
    image_ind = random_inds[i]
    plt.imshow(x_train[image_ind])
    plt.xlabel(class_names[y_train[image_ind][0]])
    plt.xticks([])
    plt.yticks([])
    plt.grid(False)
plt.show()

We normalize training images and testing images to set pixel values to the same range.
1
2
3
4
train_images = (x_train/255.).astype(np.float32)
train_labels = y_train
test_images = (x_test/255.).astype(np.float32)
test_labels = y_test
2. Compiling the Model
1
2
3
4
5
6
7
8
9
10
11
12
13
14
15
16
17
18
19
20
21
22
23
24
25
26
27
28
29
def build_cnn_model():

    cnn_model = tf.keras.Sequential([

        # Defining the first convolutional layer
        tf.keras.layers.Conv2D(kernel_size=(3,3), filters=32, activation=tf.nn.relu, input_shape=(32, 32, 3)),

        # Defining the first max pooling layer
        tf.keras.layers.MaxPool2D(pool_size=(2,2)),

        # Defining the second convolutional layer
        tf.keras.layers.Conv2D(kernel_size=(3,3), filters=64, activation=tf.nn.relu),

        # Defining the second max pooling layer
        tf.keras.layers.MaxPool2D(pool_size=(2,2)),

        # Flattening image and label vectors
        tf.keras.layers.Flatten(),

        # Defining the last Dense layer to output the classification probabilities
        tf.keras.layers.Dense(64, activation=tf.nn.relu),

        # Defining Dense layer to output classification probabilities
        tf.keras.layers.Dense(10, activation=tf.nn.softmax)
    ])

    return cnn_model

cnn_model = build_cnn_model()
1
2
3
4
5
# Initialize the model by passing some data through
cnn_model.predict(train_images[[0]])

# Print the summary of the layers in the model
print(cnn_model.summary())
Output:
Model: "sequential"
_________________________________________________________________
Layer (type)                 Output Shape              Param #
=================================================================
conv2d (Conv2D)              (None, 30, 30, 32)        896
_________________________________________________________________
max_pooling2d (MaxPooling2D) (None, 15, 15, 32)        0
_________________________________________________________________
conv2d_1 (Conv2D)            (None, 13, 13, 64)        18496
_________________________________________________________________
max_pooling2d_1 (MaxPooling2 (None, 6, 6, 64)          0
_________________________________________________________________
flatten (Flatten)            (None, 2304)              0
_________________________________________________________________
dense (Dense)                (None, 64)                147520
_________________________________________________________________
dense_1 (Dense)              (None, 10)                650
=================================================================
Total params: 167,562
Trainable params: 167,562
Non-trainable params: 0
_________________________________________________________________
None
Compiling the model with the parameters below.
- Adam optimizer
- Learning rate of .001
- Sparse Categorical Crossentropy Loss
1
2
3
cnn_model.compile(optimizer=tf.keras.optimizers.Adam(learning_rate=1e-3),
              loss='sparse_categorical_crossentropy',
              metrics=['sparse_categorical_crossentropy'])
3. Training the Model
1
2
3
4
5
BATCH_SIZE=64
EPOCHS=10

modfit=cnn_model.fit(train_images, train_labels, batch_size=BATCH_SIZE, epochs=EPOCHS,
          validation_data=(test_images, test_labels))
Train on 50000 samples, validate on 10000 samples
Epoch 1/10
50000/50000 [==============================] - 20s 391us/sample - loss: 0.3894 - sparse_categorical_crossentropy: 0.3894 - val_loss: 1.0823 - val_sparse_categorical_crossentropy: 1.0823
Epoch 2/10
50000/50000 [==============================] - 19s 372us/sample - loss: 0.3628 - sparse_categorical_crossentropy: 0.3628 - val_loss: 1.1945 - val_sparse_categorical_crossentropy: 1.1945
Epoch 3/10
50000/50000 [==============================] - 19s 380us/sample - loss: 0.3376 - sparse_categorical_crossentropy: 0.3377 - val_loss: 1.1977 - val_sparse_categorical_crossentropy: 1.1977
Epoch 4/10
50000/50000 [==============================] - 19s 384us/sample - loss: 0.3162 - sparse_categorical_crossentropy: 0.3162 - val_loss: 1.2850 - val_sparse_categorical_crossentropy: 1.2850
Epoch 5/10
50000/50000 [==============================] - 19s 373us/sample - loss: 0.2988 - sparse_categorical_crossentropy: 0.2988 - val_loss: 1.3134 - val_sparse_categorical_crossentropy: 1.3134
Epoch 6/10
50000/50000 [==============================] - 19s 381us/sample - loss: 0.2772 - sparse_categorical_crossentropy: 0.2772 - val_loss: 1.3929 - val_sparse_categorical_crossentropy: 1.3929
Epoch 7/10
50000/50000 [==============================] - 21s 419us/sample - loss: 0.2608 - sparse_categorical_crossentropy: 0.2608 - val_loss: 1.4771 - val_sparse_categorical_crossentropy: 1.4771
Epoch 8/10
50000/50000 [==============================] - 28s 569us/sample - loss: 0.2373 - sparse_categorical_crossentropy: 0.2373 - val_loss: 1.5166 - val_sparse_categorical_crossentropy: 1.5166
Epoch 9/10
50000/50000 [==============================] - 28s 568us/sample - loss: 0.2179 - sparse_categorical_crossentropy: 0.2179 - val_loss: 1.6101 - val_sparse_categorical_crossentropy: 1.6101
Epoch 10/10
50000/50000 [==============================] - 29s 573us/sample - loss: 0.2144 - sparse_categorical_crossentropy: 0.2144 - val_loss: 1.5843 - val_sparse_categorical_crossentropy: 1.5843
4. Evaluate the Model
We can evaluate the model by calculating the test loss.
1
test_loss = cnn_model.evaluate(x=test_images, y=test_labels)
Output:
10000/10000 [==============================] - 1s 148us/sample - loss: 1.5843 - sparse_categorical_crossentropy: 1.5843
[1.5843368148803711, 1.5843371]
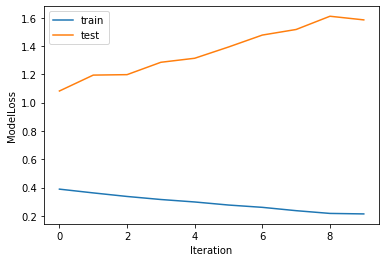
We plot the test and training loss by iteration.
1
2
3
4
5
6
plt.plot(modfit.history['loss'])
plt.plot(modfit.history['val_loss'])
plt.ylabel('ModelLoss')
plt.xlabel('Iteration')
plt.legend(['train', 'test'], loc='upper left')
plt.show()

It looks like the loss for the test and training data set declines after epoch equals to 8.
Predictions
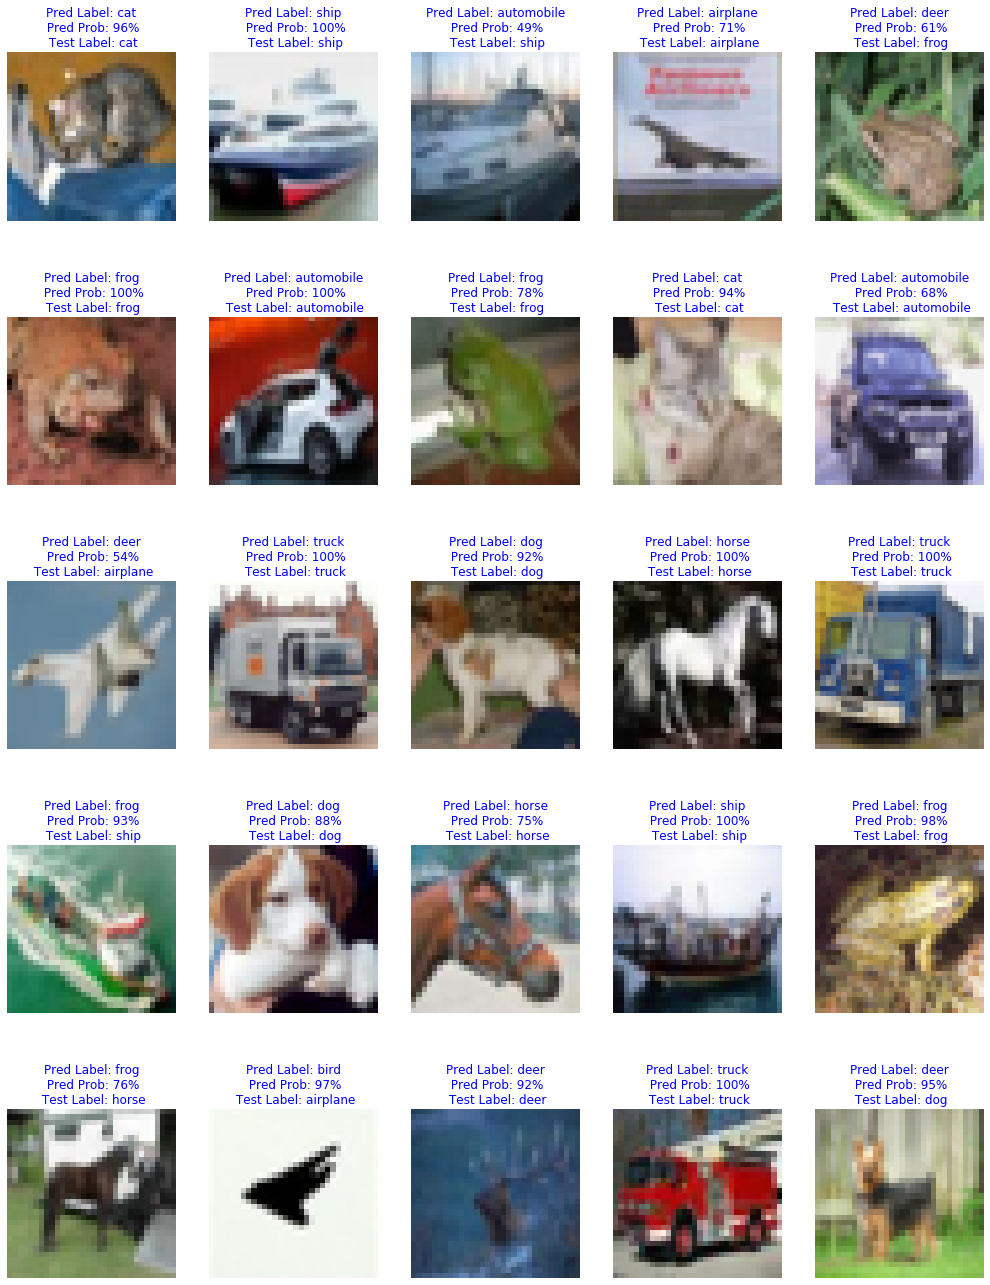
Let’s make a few predictions and check the test labels to see if the predictions are correct.
Note, the model can be very confident with high prediction probabilities even for incorrect predictions.
1
2
3
4
5
6
7
8
9
10
11
12
13
14
15
16
17
18
19
20
21
22
test_images=np.reshape(test_images, (10000,32,32,3))

# predictions on test data
predictions = cnn_model.predict(test_images)
prediction = np.argmax(predictions, axis=1)

# the probability of predictions
prediction_probs = np.max(predictions, axis=1)*

num_rows = 6
num_cols = 6
plt.figure(figsize=(3*num_cols-.5, 4*num_rows-.5))
for i in range(25):
    plt.subplot(5,5,i+1)
    plt.imshow(test_images[i])
    plt.title("Pred Label: {}\n Pred Prob: {:.0f}%\n Test Label: {}".format(
    class_names[prediction[i]], prediction_probs[i], class_names[test_labels[i][0]]), color='blue')
    plt.xticks([])
    plt.yticks([])
    plt.grid(False)
    plt.axis(False)
plt.show()

The full jupyter notebook can be found on my GitHub here.
References: MIT’s Deep Learning lab.